Beyond its immediate value in terms of helping you increase customer satisfaction and loyalty, MaritzCX Case Management also presents you with a rich new source of data to use in reporting. Follow these steps to do so.
Step 1
First you must specify your case management program as a data source. Go to Dashboards II:
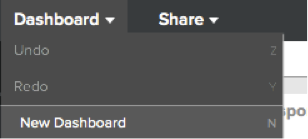
Select Dashboard | New Dashboard.
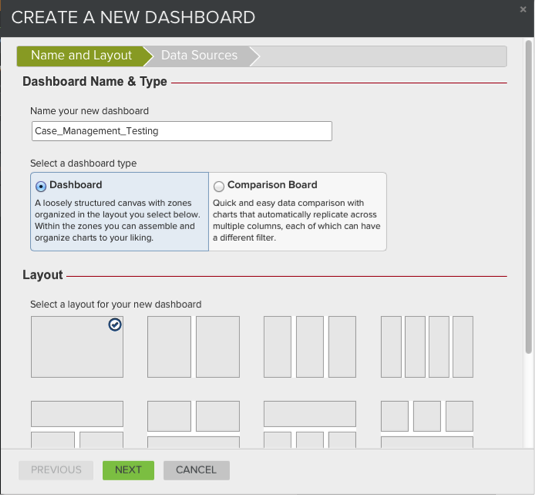
Name your dashboard and define its layout, then click Next.
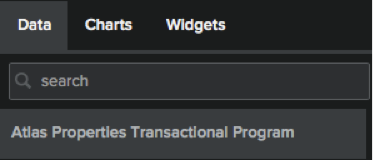
On the Data Sources tab, use the plus sign to select the case management program you want to add as a data source. Notice that when you do so, any surveys associated with the program are also added under Selected Data Sources:
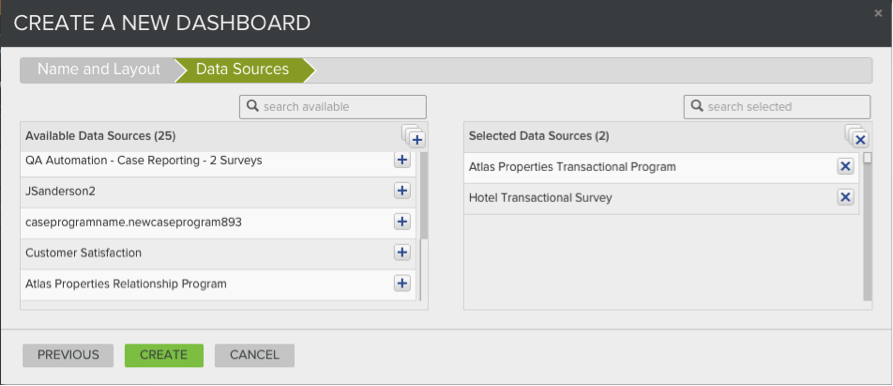
Click Create.
Step 2
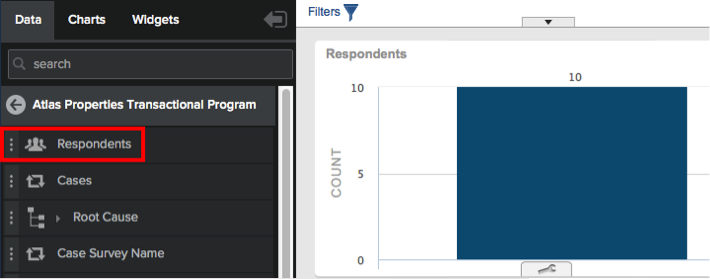
Your new blank dashboard appears. Note that its Data pane contains the case management program you specified when you created the dashboard:
Open the program and scroll to the bottom of the list to find the survey or surveys it is based on:

You can now begin defining charts on your dashboard. The following steps give a couple of different examples of how to do this. They are not meant to be exhaustive, but simply to provide you with a starting point.
Step 3a
Case data can enrich your dashboards in many ways. For instance, you might create a chart that shows survey respondents broken down by those who have a case and those who do not.
Start by adding Respondents from your program data:
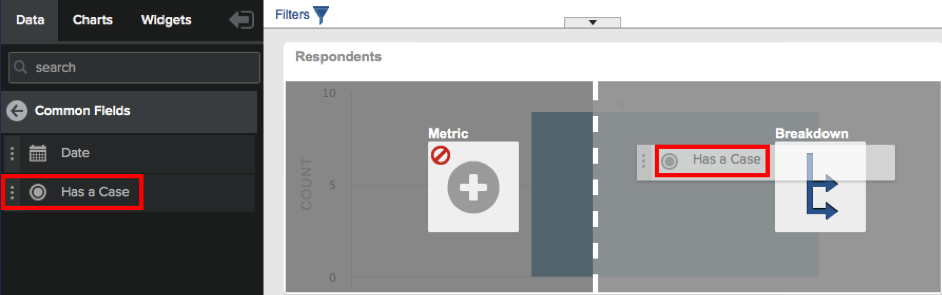
Next, go to Common Fields in the Data pane, then drag and drop Has a Case onto your Respondents chart:
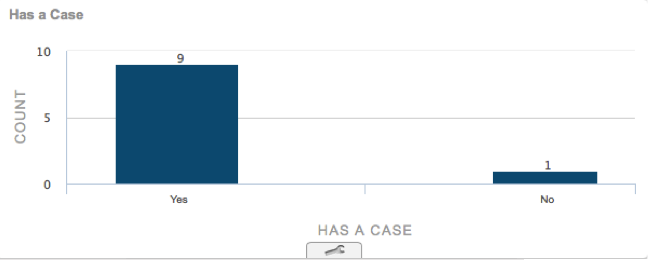
The dashboard is regenerated as a breakdown of the number of respondents who have a case and those who don't:
Step 3b
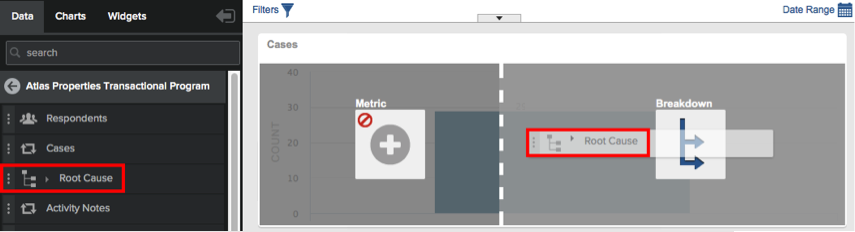
Another useful chart might be a breakdown of your cases by root cause.
Start by adding Has a Case from your program data:
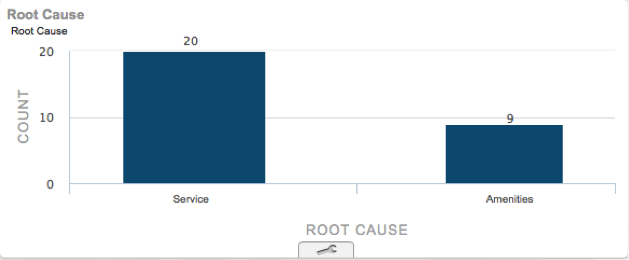
Next, drag and drop Root Cause onto your Cases chart:
The dashboard is regenerated as a breakdown of the number of cases with each root cause:
These two use cases give you a couple of examples of how you might use Case Management data in your reporting, but the additional possibilities are endless.
For more information on how to use Dashboards 2, see that section of the MaritzCX online help system.