There are a couple of different ways to subdivide your data in Dashboards 2:
Splitting a metric over another question is similar to applying a breakdown. The difference is that splitting a metric only applies the split to that single metric, whereas adding a breakdown applies the breakdown to all the metrics in the chart.
To add a split to a metric, select Split from the dropdown menu, then drag and drop the desired metric into the subordinate field, as in this screenshot:
So here is how the chart will display, with the columns on the left showing a metric split by another metric:
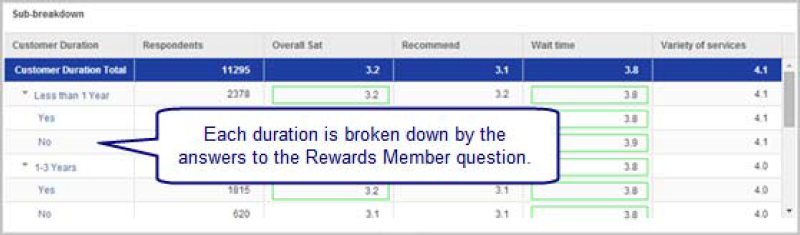
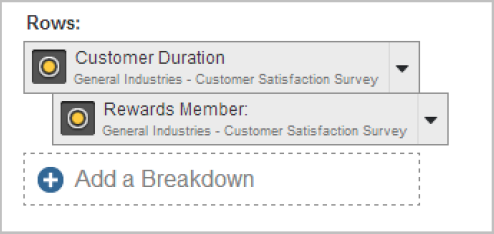
In tables, you can choose to add a sub-breakdown which allows you to show the relationship between two questions. In this case, "Rewards Member" has been used as a sub-breakdown of "Customer Duration", as indicated by the indentation.
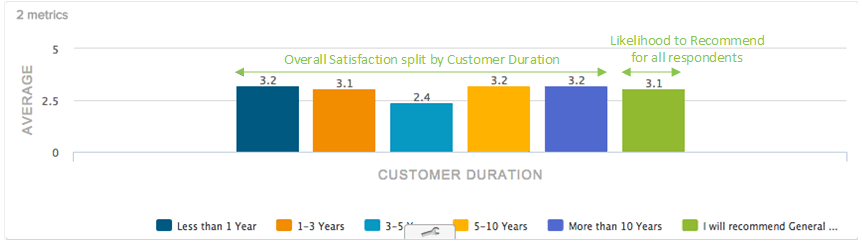
As you can see in the following chart, each answer to the customer duration question shows the breakdown of that answer by whether the respondent answered yes or no to the rewards member question: