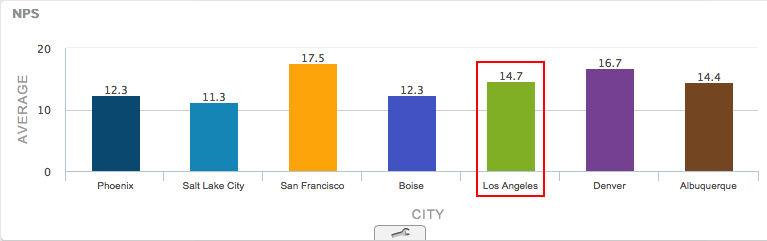
Yes. You can drill down from any chart to access a basic response list. In our example we'll start with a chart that breaks down NPS® by city. Then we'll drill down to show individual responses from Los Angeles.
1. Click on the column for Los Angeles.
2. Click Configure Column.
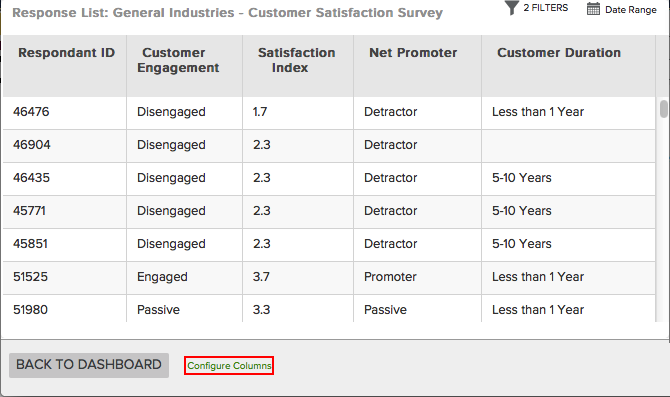
3. Now, use the data panel to drag and drop questions you want to display in the columns.