This section contains frequently asked questions about Dashboards 2 and gives you tips on how to resolve some common problems.
I just updated analyst filters. Why isn't the system displaying the right data?
Can anyone take a snapshot? Can anyone schedule an export?
Can I create a time-trend stacked bar chart?
What if Dashboards 2 is running slowly?
How do I display values on trend lines?
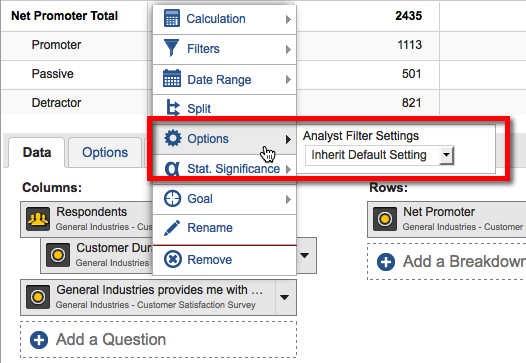
Can I assign different "Ignore Analyst Filters" settings to metrics within the same chart?
Can I create a Top 4 Box or Bottom 4 Box chart?
Why is text small or blurry in PDFs? How can I fix it?
Can I insert blank space in a dashboard?
Can I create footers for charts?
How can I make my dashboards faster?
How do I show individual responses on the dashboard?
Can I do time trends of every other year?
How is NPS® calculated in Dashboards 2?
How are Top Box and Bottom Box scores determined?
How do stack calculations work?
How long does it take for a response to display in Dashboards 2?
In Ranking questions, what does "Rank Score" mean?
In a hierarchy, can an interaction point report up through more than one manager?
How do I add hyperlinks in Dashboards 2?
How do I create cross-tabs [heat maps]?
How do I create year over year (YOY) comparisons in Dashboards 2?
How do I apply analyst filters?
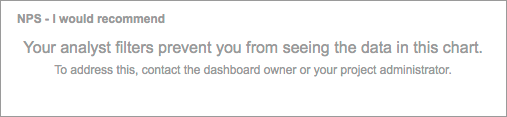
This message displays when the dashboard has been shared with you, but your analyst permissions restrict access to some or all of the data in the chart.
To enhance performance, the system stores OS analyst filters in the user session. To see filters that were updated during the current session, exit the system and log in again.
This message is usually caused by a problem with cookies. To resolve it, do the following: clear cookies, log out, and log in again.
Anyone who can view a dashboard can create a PDF or snapshot of it. Readers and sharees (those who have a dashboard shared with them) cannot schedule exports.
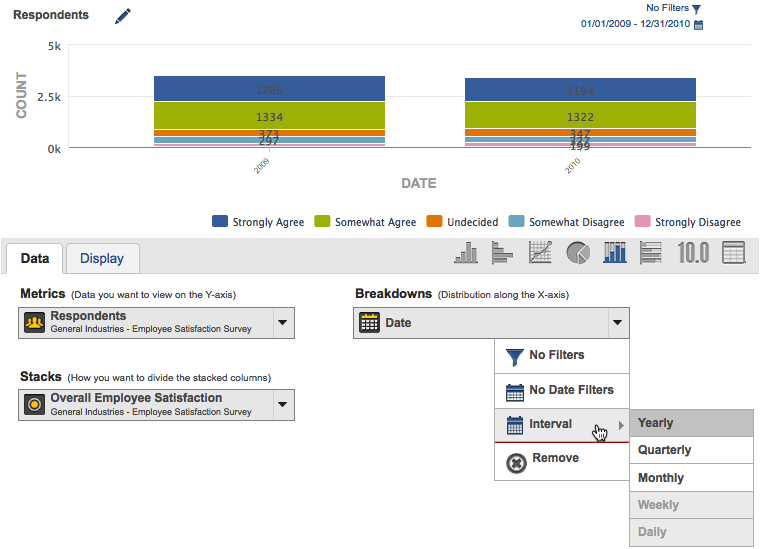
Yes. Create a stacked bar chart, and put "Date" in the breakdown. You can change the interval on the date breakdown, as shown here:
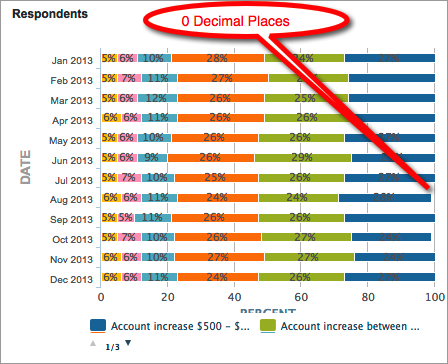
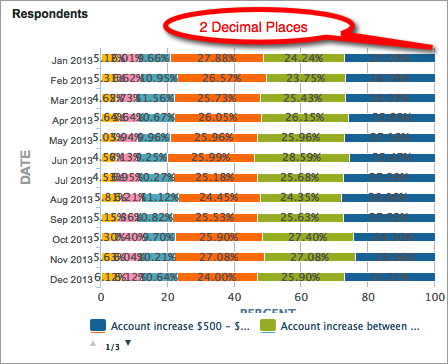
It's probably because decimal places are affecting the outcome. For example, here are two versions of the same chart. The first one has decimal places at 0, which means that some of the bars add up to 99 and some add up to 101. The second chart has decimal places set to 2, so the totals appear correctly.
If charts take a long time to populate, try closing other applications on your machine. Dashboards 2 needs at least 1 gigabyte of available RAM to run well.
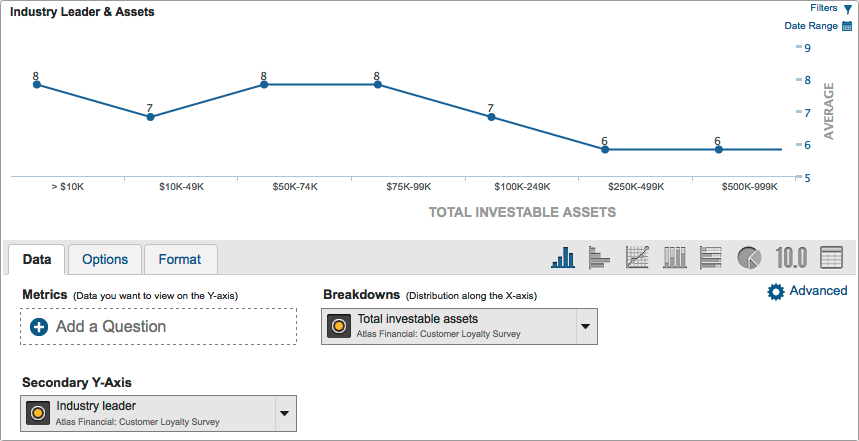
Define the trend line with a secondary Y-axis that displays the points:
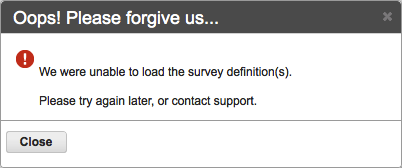
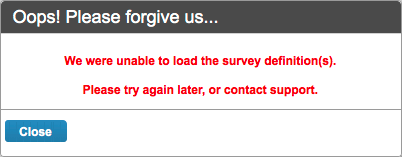
This message displays if the account you are in does not have access to any surveys. To fix the problem, provide the user access to at least one survey.
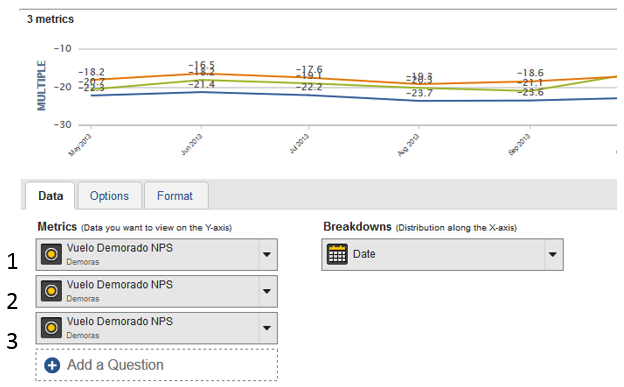
Yes. For example, you might want to trend NPS® three times in one chart:
1. The analyst’s NPS® (with analyst filter applied),
2. The regional average (unfiltered),
3. The company average (unfiltered).
To hide analyst filters for individual metrics, open the metric menu you want to change select Options:
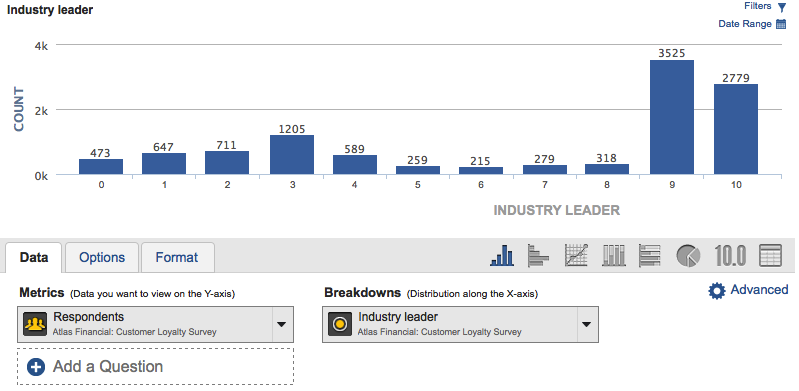
Yes. There is a way to display Top 4 Box in Dashboards 2, or any other Box Score that is not directly supported. This example describes how to display Top 4 Box:
1. Create a chart with a scale question in the breakdown. If the scale question holds answers you don't want to include in the calculation (such as "don't know" or "refused"), use the chart's filter control to exclude those answers.
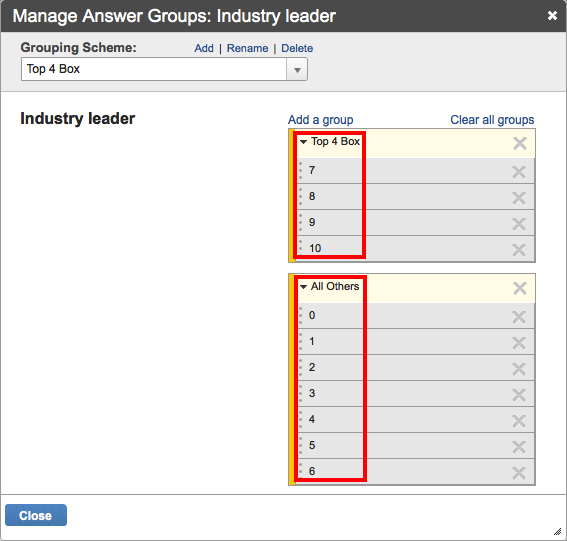
2. From the breakdown's menu, select Answer Groups, and create 2 answer groups: one with the top 4 answers, and the other with the remaining answers:
3. Turn the calculation in the metric to percentage:
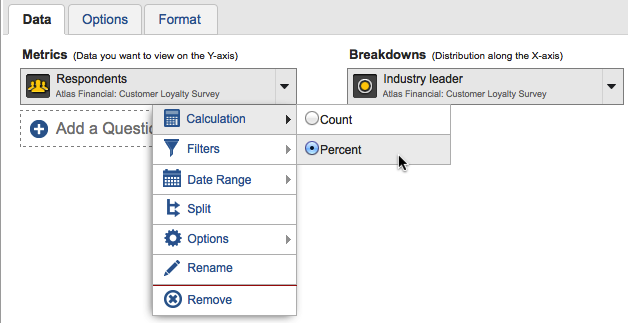
The chart will look like this:
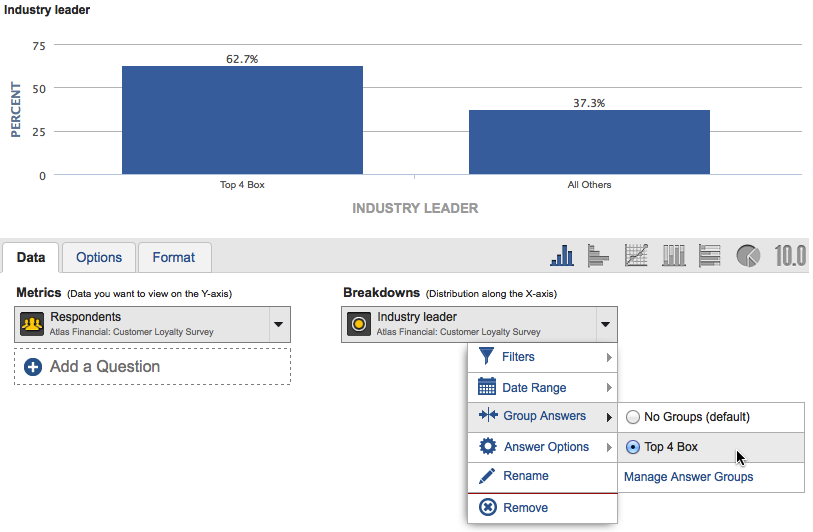
4. Hide the second Answer Group:
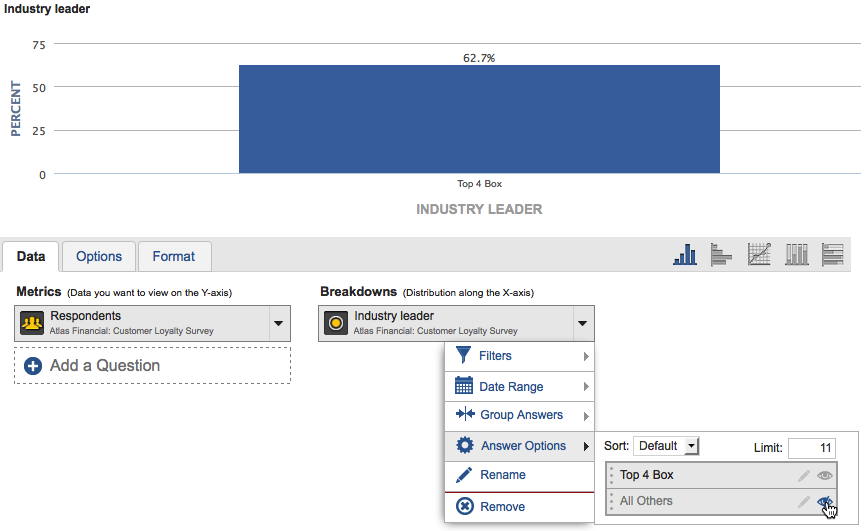
The resulting chart will display the top 4 box.
During PDF creation, Dashboards automatically shrinks the width of the dashboard to fit within the page size. This can cause text to appear blurry or look too small. To create a more readable PDF, make the dashboard the width of the paper size, by reducing the width of the dashboard until just before you start seeing the side of the dashboard disappear. When you create PDFs, they will then come across at full resolution.
Yes. You can use the Text & Image Widget to insert blank space in a dashboard.
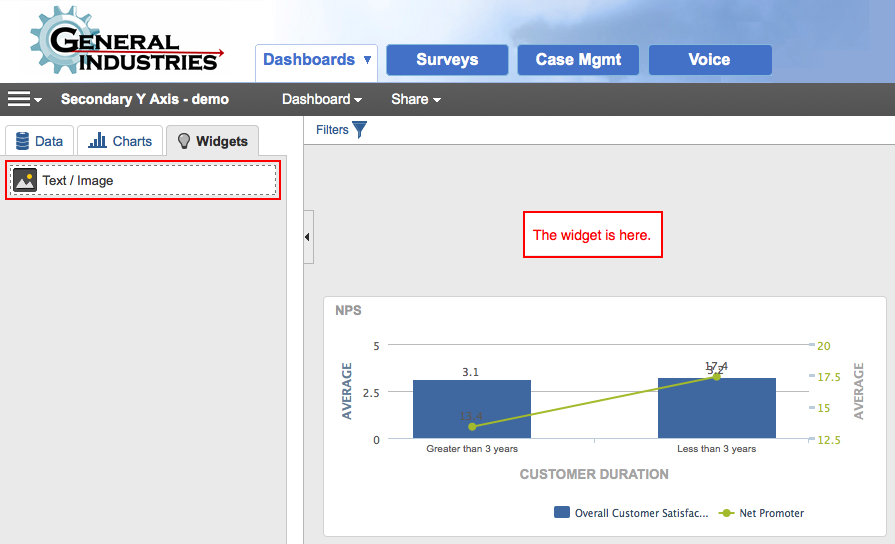
Follow these steps to do so:
1. Drag a Text/Image widget onto the dashboard where you want blank space to appear.
2. Edit the Text/Image widget.
3. Turn off the Widget Border and the Widget Background.
4. Insert at least three spaces in the text area (to indicate to the widget that there is content inside).
5. Click OK. Blank space will appear where the widget is. You can make the blank space taller by dragging the bottom of the widget down.
Yes. You can create footers by using the same method explained in Can I insert blank space in a dashboard? Simply place the Text/Image widget directly below the chart.
Dashboards 2 makes it possible to report on millions of records in multiple charts. Because it relies on your processor speed, you may sometimes find that you need to increase the display speed of your dashboards. To help you optimize your dashboard performance, we've provided these general guidelines:
Place less than 25 charts in a dashboard (this is an estimate based on an average complexity per chart -- you can experiment to find the right number of charts to display in one dashboard).
In the breakdown of a chart, include categorical questions with less than 500 items.
Do not use complex breakdowns in connection with complex splits.
Limit the amount of sorting done in charts.
Limit the number of metrics in a chart to 5 or less.
On the Options tab, use the feature "Hide fewer than x responses" less often.
Limit the number of verbatim charts to 5 or less in the dashboard, because verbatim text increases the amount of data that is transferred over the web.
Limit the size of filters that are applied. For example, if a filter includes several answers within a categorical question, consider using "Doesn’t Equal" instead of "Equals".
Use fewer stack charts.
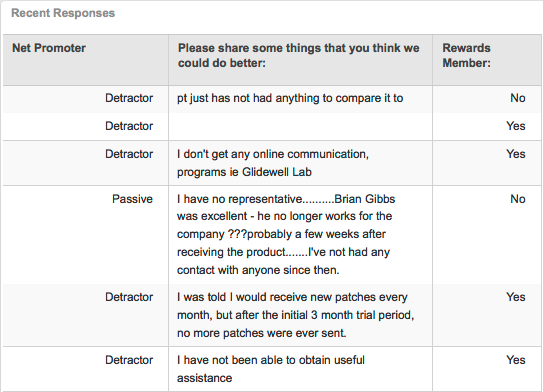
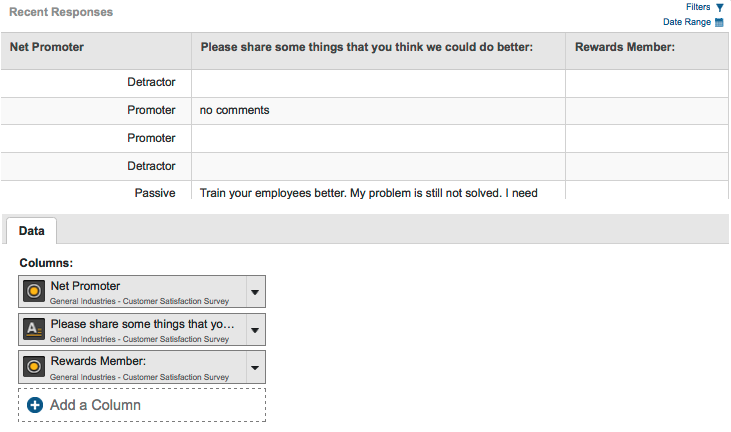
You can create a table like the one below. It displays every response, and displays the most recent responses first. You build this by dragging a verbatim onto the canvas, and then adding extra fields you’d like to see in the chart metrics.
Yes.
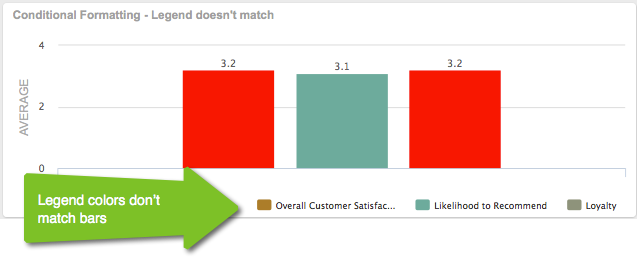
Here is a chart that has conditional formatting turned on. Notice how the legend colors do not match the bar colors.
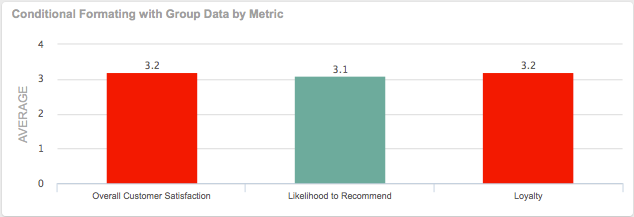
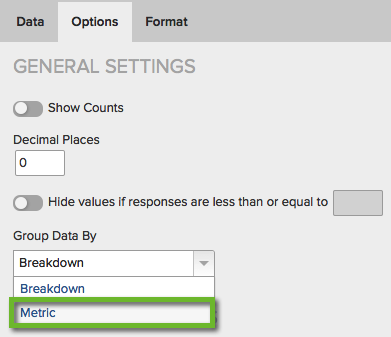
You can prevent this problem by using the Group by Metric feature. To do so, double click on the chart, choose the Options tab, and change the Group Data by setting to Metric. Here is the adjusted chart:
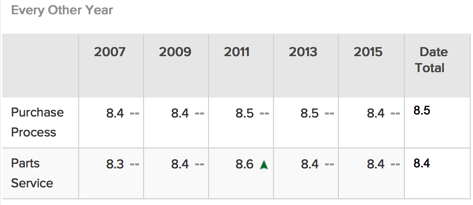
Yes. You can do time trends for bi-yearly or other intervals. To do so, make sure the data holds dates for every other year. You can also do statistical testing on every other year, as shown here:
The NPS® calculation on metrics will calculate the NPS® in the way shown below. A question with less than 3 or more than 11 categories will not calculate.
| Question Categories | Promoter Categories | Passive Categories | Detractor Categories | Calculation |
3 |
Top Box |
1 |
Bottom Box |
Top Box - Bottom Box |
4 |
Top Box |
1 |
Bottom 2 Box |
Top Box - Bottom 2 Box |
5 |
Top 2 Box |
1 |
Bottom 2 Box |
Top 2 Box - Bottom 2 Box |
6 |
Top 2 Box |
2 |
Bottom 2 Box |
Top 2 Box - Bottom 2 Box |
7 |
Top 2 Box |
2 |
Bottom 3 Box |
Top 2 Box - Bottom 3 Box |
8 |
Top 2 Box |
2 |
Bottom 4 Box |
Top 2 Box - Bottom 4 Box |
9 |
Top 2 Box |
2 |
Bottom 5 Box |
Top 2 Box - Bottom 5 Box |
10 |
Top 2 Box |
2 |
Bottom 6 Box |
Top 2 Box - Bottom 6 Box |
11 |
Top 2 Box |
2 |
Bottom 7 Box |
Top 2 Box - Bottom 7 Box |
To determine top/bottom boxes, we sort the values high to low. The highest score becomes the top box. The lowest score becomes the bottom box.
A score of -99 is ignored (“Don’t Know/Refused” in the example below). Below, "Extremely Likely" would be the top box, and "Extremely Unlikely" would be the bottom box.
| Sample Question | Score |
Extremely Likely |
7 |
Very Likely |
6 |
Fairly Likely |
5 |
Neither Likely nor Unlikely |
4 |
Fairly Unlikely |
3 |
Very Unlikely |
2 |
Extremely Unlikely |
1 |
Don’t Know / Refused |
-99 |
Stacks show the number of answers in the Stack variable, not the number of answers in the Breakdown variable.
For example, if your breakdown is Gender, which has a response count total of 400 people (200 Male, 200 Female), and your stack is Shirt Color, which has a low response rate of 100 people, then the column for Male will only show the intersection of the two. The Male breakdown value could have 200 people, but when you intersect it with Shirt Color, there may only be 50 people.
| Gender (n=400) | Shirt Color (n=100) |
Male |
|
Male |
Blue |
Male |
Red |
Male |
|
Female |
|
Female |
Pink |
Female |
Pink |
Female |
|
Responses are made available in Dashboards 2 through a transformation process (ETL) that occurs every hour at the top of the hour. During the transformation process, new responses are moved into the big data platform where they are made available to Dashboards 2 at some point after the hour. Transformation time depends on the amount of new data that has arrived.
For example, a response for Company A comes in at 9:55am. It will be processed at 10am. As soon as Company A's processing is completed, the response will be available in Dashboards 2. Responses typically appear in Dashboards 2 between 10 minutes and 2 hours from the time the response was submitted.
Note: Most companies have processing times that fit under 1 hour. If the processing time goes over an hour, then the next transformation is skipped. In the example, above, if Company A has long processing times, the 9am processing may still be occurring at 10am. In that case, the processing would start at 11am.
The Rank Score allows you to easily see which items were ranked highest overall. It is a calculation you can perform on Rank questions.
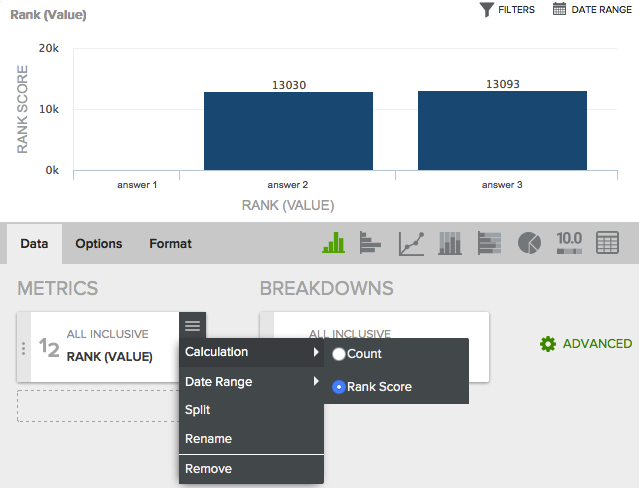
The calculation is shown in the example below.
if you have 3 answer options, they can each be ranked 1, 2, or 3 by each respondent. The rank score shown in Reporting is an inverse-weighted version, so those that ranked it a 1 will get 3 points, 2 will get 2 points, and 3 will get 1 point. We sum them to get the final score. Here is an example:
For a "Rank these foods" question:
Pizza
25 people ranked #1
15 people ranked #2
5 people ranked #3
Hamburger
20 people ranked #1
10 people ranked #2
15 people ranked #3
Steak
35 people ranked #1
5 people ranked #2
5 people ranked #3
Therefore, the Rank Score in Reporting would be:
Pizza: (25*3) + (15*2) + (5*1) = 110
Hamburger: (20*3) + (10*2) + (15*1) = 95
Steak: (35*3) + (5*2) + (5*1) = 120
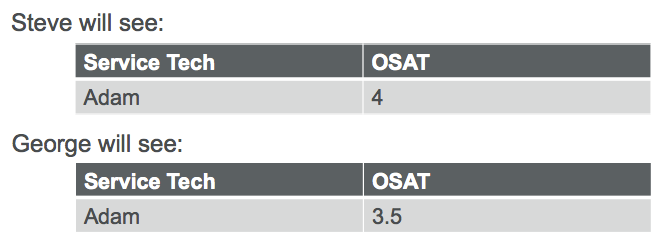
There may be times when you want several managers to see the results of a single employee. The platform can support this use case as long as each of the interaction points’ survey scores can be differentiated by which manager was responsible at the time of service. Below is an example.
Let's say you have two managers, Steve and George, who each have partial responsibility for Adam's work. You can represent Adam's work under two interaction point IDs (note that each Node ID in hierarchies must be unique).
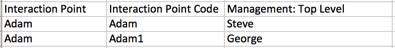
Note that the name "Adam" will show up in reporting for both Steve and George, because the Interaction Point is shown in reporting, not the Interaction Point Code.
In the survey data, place "Adam" in the response data when his work is under Steve's responsibility, and place "Adam1" (or some other unique ID) for his work when he's under George's responsibility.
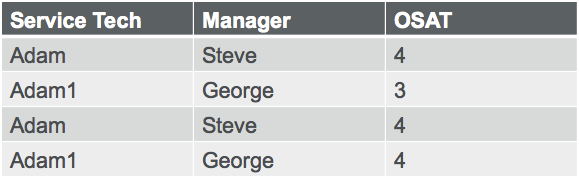
With the data shown above, reporting in Dashboards 2 will look like this. Both Steve and George will be able to drill through to their reports, with Adam's associated data displaying.
Hyperlinks can be displayed in dashboards so that users can open phone survey data, or other web information. The hyperlink should include a complete HTML link (i.e., <a href=…..).
If you are unable to import the entire HTML link, below are two approaches you can use with Custom Fields. Both will result in a link that is clickable within dashboard response tables, or the chart response list. Both approaches will update automatically if the URL in the text field changes (i.e., the URL will update nightly, with the custom fields' nightly run).
The first technique requires you to pass only the root of the URL into the survey record. For example, "www.maritzcx.com" will be formatted correctly, but "http://www.maritzcx.com" will not.
A custom field wraps HTML around the URL that is stored in a "short text" column. The custom field, below, works by taking the value in the "URL – Short" column, adds the HTML and assigns it to a variable called "Hyperlink".

Assuming that call recording vendors will assign each recording a unique ID and they have a standard URL format, this approach combines the HTML and URL together and then wraps it around the unique ID. In this case the HTML and URL are hard-coded and the unique ID is passed into the custom field.

Both approaches require you to ensure that the data coming in is formatted correctly.
After the custom field has run (custom fields currently run nightly), clicking on the ‘URL – Short’ field takes the user to the response record and clicking on the Hyperlink field takes them to the website. Here is an example:
Short URL |
Hyperlink |
NYPost.com |
NYPost.com |
BostonGlobe.com |
BostonGlobe.com |
Boston.com |
Boston.com |
MaritzCX.com |
MaritzCX.com |
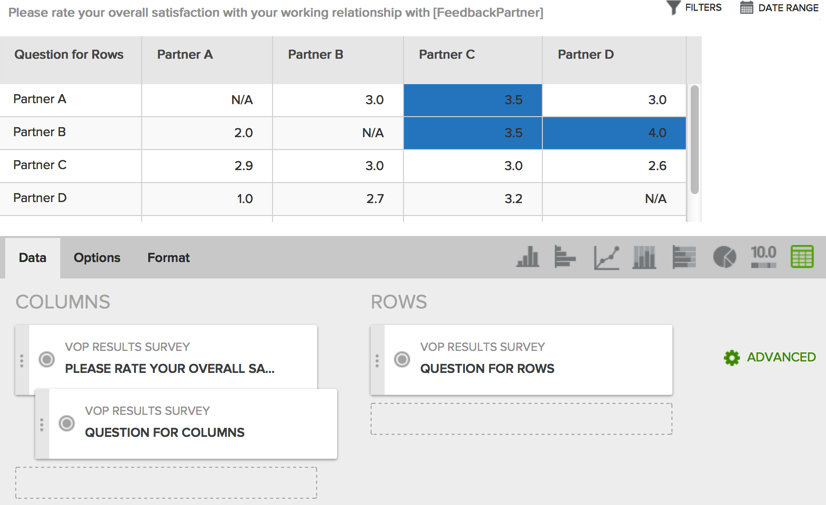
To create a cross-tab, create a table with the metric you want to measure. On the metric, select "Split" and drag in the categorical you want to display in the columns. Place the other question you want to cross-tab as a Row. See the image below for an example.
You can then use conditional formatting to color the cells.
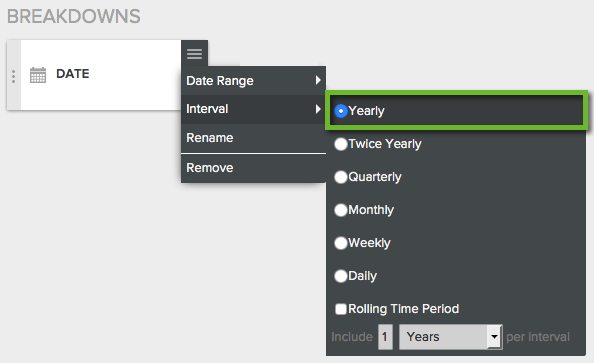
In Dashboards 2, year over year comparison charts like this one are easy to create.
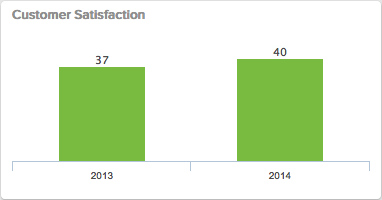
Simply choose a "Yearly" interval from the Date breakdown, as shown here:
But, what if you want to create a chart that compares a quarter, or a month year over year? Say, for example, you want to compare the current month against this same month last year. You can create charts like this using date ranges on multiple metrics. This method can be used to display segmented data of any type.
First, create a chart with two copies of the metric you want to display. In our example below, the Satisfaction metric is displayed twice.
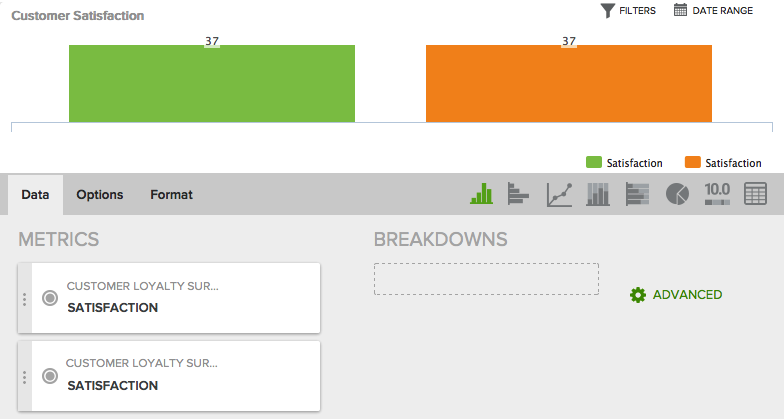
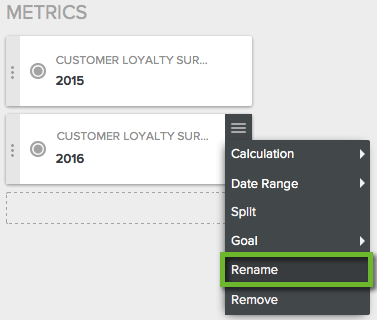
Rename each metric as you'd like. In this example, we're calling the first metric "2015," and the second metric "2016."
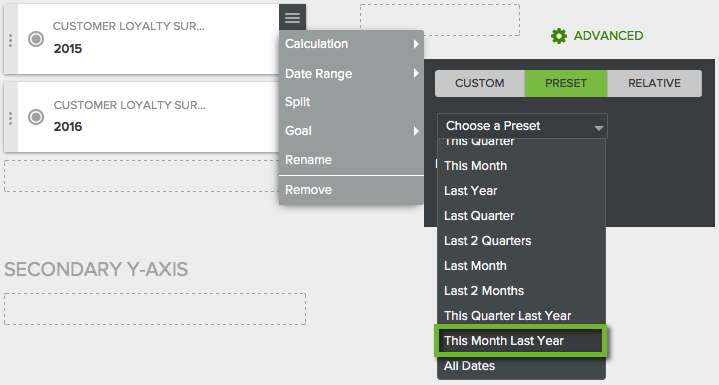
Next, filter each metric by the date range you want it to display. Choose "Date Range" from the Metric pancake menu, then click on the Preset tab and select "This Month Last Year" as the Preset. Any date range can be defined here, so you can choose from any of the options. Filter the second metric with "This Month" as the date range.
Now each column in the chart displays this month's data, YOY.
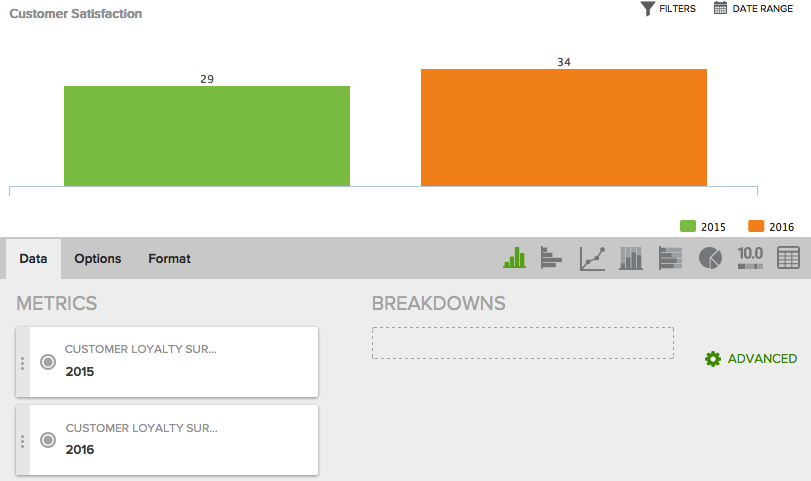
Next, if you'd like the labels to display directly under the columns, select the Options tab, and group data by "Metric".
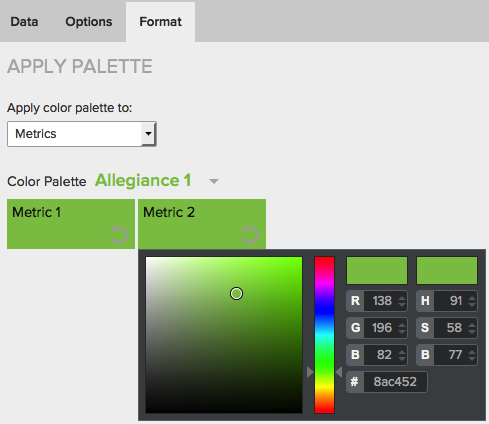
Finally, if you want both bars to be the same color, adjust the colors under the Format tab:
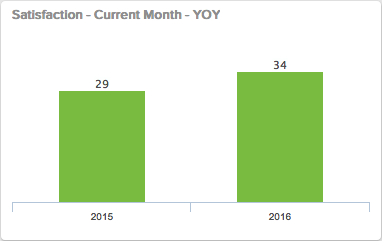
Here is the final chart, comparing the current month, year over year. This method can be used to display any of your data, filtered by any date range or segment.
When you share a dashboard, the sharee's dashboard is automatically filtered by their Analyst Permissions (also called Analyst Filters), which are set in Manage Survey | Manage Analysts. This prevents them from seeing data beyond their scope of responsibility. However, there may be times when you want them to see all data. Charts automatically inherit the dashboard-level setting for this option unless you change it.
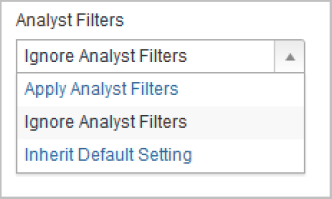
As with other filters, specific settings will override more general settings.